Support and resistance are the key terms in technical analysis and invaluable tools in every crypto trader’s toolbox. They reflect asset’s supply and demand and overall cryptocurrency market psychology. Our today’s article explains support and resistance levels and how to trade using these tools.
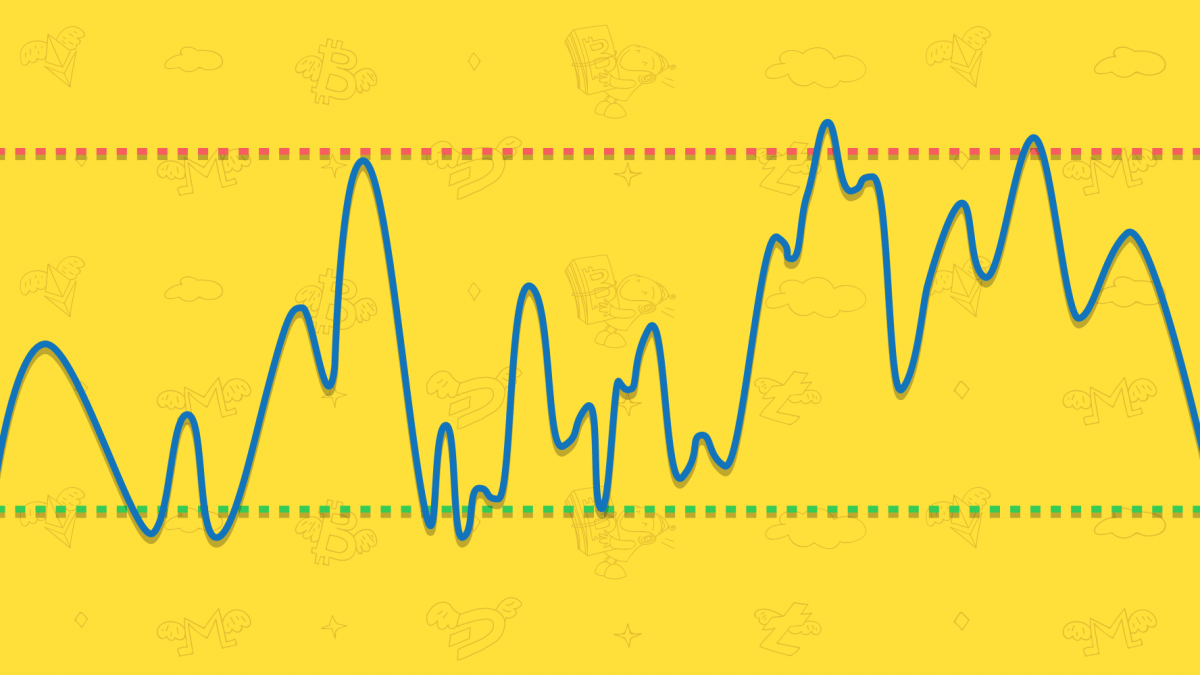
What are Support and Resistance levels?
Support and resistance are displayed as horizontal or angled lines. Support is a price level at which the crypto price tends to bounce back up after a down period. At this level the demand picks usually up and prevents price from falling down further as the buyers find the price attractive enough to buy and sellers are less willing to sell. If the support level doesn’t hold and the price of cryptocurrency continues to fall it indicates that the bearish sentiment has augmented.
Resistance level is the opposite of support. When the price reaches resistance it means that the buyers are less inclined to buy coins at this price level and those who hold the stock or bought it earlier find the price attractive enough to sell. You may say the resistance level is the max price of an asset as estimated by the crypto market participants in this period. In case of increased demand and bullish mood of the market participants, the resistance level breaks and the price finds a new resistance higher and previous resistance level may turn into support line. On the contrary, the previous support level may also turn into resistance if the price dips far beyond the drawn line.


Support and resistance lines also identify the trend of cryptocurrency. In the uptrend Support and Resistance lines point up and each high is higher than the previous high whereas in the downtrend happens exactly the opposite and each low is lower than the previous one.

What else should you know about Support and Resistance to trade successfully?
Support and Resistance levels are sometimes also divided into major and minor ones. The prices usually fall through minor levels even though there might be some bouncing around them. Depending on how the price of cryptocurrency acts around the minor levels we could determine whether a strong trend continues or the price range is developing. Major support and resistance levels are the ones that mark the areas that caused trend reversals. Curiously, Support and Resistance levels are usually placed around round numbers such as 5, 50, 100 that serve as a psychological reference to market participants.
An asset is usually traded above the support level and below the resistance although in technical analysis it’s acceptable to draw the lines slightly or below the price picks. This is especially true for volatile cryptomarket. For this reason sometimes it makes more sense to draw support and resistance zones instead of lines. Support zone is plotted using previous lows and resistance zone is drawn based on previous highs. Zones are suited best for long periods whereas exact levels best suited for narrow trading ranges.
When supply and demand are equally balanced there’s usually little volatility and the crypto asset’s price moves within a trading range. A break from a trading range signal that either bulls or bears have finally scored the victory.
The crypto trading strategy based on support and resistance levels is the following: buy slightly above the support in the uptrends and sell near the resistance in downtrends. Remember, there’s no assurance that the support and resistance will hold, take an extra step and wait until the trends confirmation. Combine support and resistance levels with other indicators that confirm the trend.
How to draw Support and Resistance lines on a chart?
It’s really easy to do, you only need a price chart and a tool to draw lines. Just follow these steps:
1. Look for the next major price picks above and below the current price and draw support and resistance levels.
2. Take a look at the overall chart to see how the price of crypto has acted around those levels previously and whether they make sense. Don’t forget that support and resistance can turn one into another.
3. Repeat the previous steps to figure out next major levels. As a result you’ll get a chart with several lines that may potentially be the next major support or resistance levels.

Support and resistance levels come also handy if you’ve automated your crypto trading. The exchanges integrated with TradeSanta have tools to draw support and resistance levels on their charts. The best moment to set up a long bot is the the price is slightly above the support level and when the price reaches resistance, it’s time to start a short crypto bot. If you haven’t automated your trading yet, join TradeSanta, we’ll guide through every step.
FAQ
What are Support and Resistance levels?
Support is a price level at which the crypto price tends to bounce back up after a down period.
Resistance level is the opposite of support: when the price reaches resistance it means that the buyers are less inclined to buy coins at this price level and those who hold the stock or bought it earlier find the price attractive enough to sell.
How to draw Support and Resistance lines on a chart?
It’s really easy to do, you only need a price chart and a tool to draw lines.
Can Support and Resistance lines identify the trend of cryptocurrency?
Support and resistance lines also identify the trend of cryptocurrency. In the uptrend Support and Resistance lines point up and each high is higher than the previous high whereas in the downtrend happens exactly the opposite and each low is lower than the previous one.
What is QFL trading strategy?
QFL stands for Quickfingersluc, and sometimes it is referred to as the Base Strategy. Its main idea is about identifying the moment of panic selling and buying below the base level.