Momentum crypto Indicators are used by traditional traders as well as crypto traders to measure the strength of an asset’s price movements. Momentum indicators are typically represented as oscillators and rather measure the rate of the price movements. They are rarely used alone, more often in combination with other indicators. Momentum indicators are most commonly applied to confirm the correct interpretation of trend indicators.
In our today’s analysis of momentum indicators we’ll look out into most common indicators used to determine momentum: Momentum, ROC, RSI, Stochastic Oscillator, CCI and MACD.
Momentum and ROC
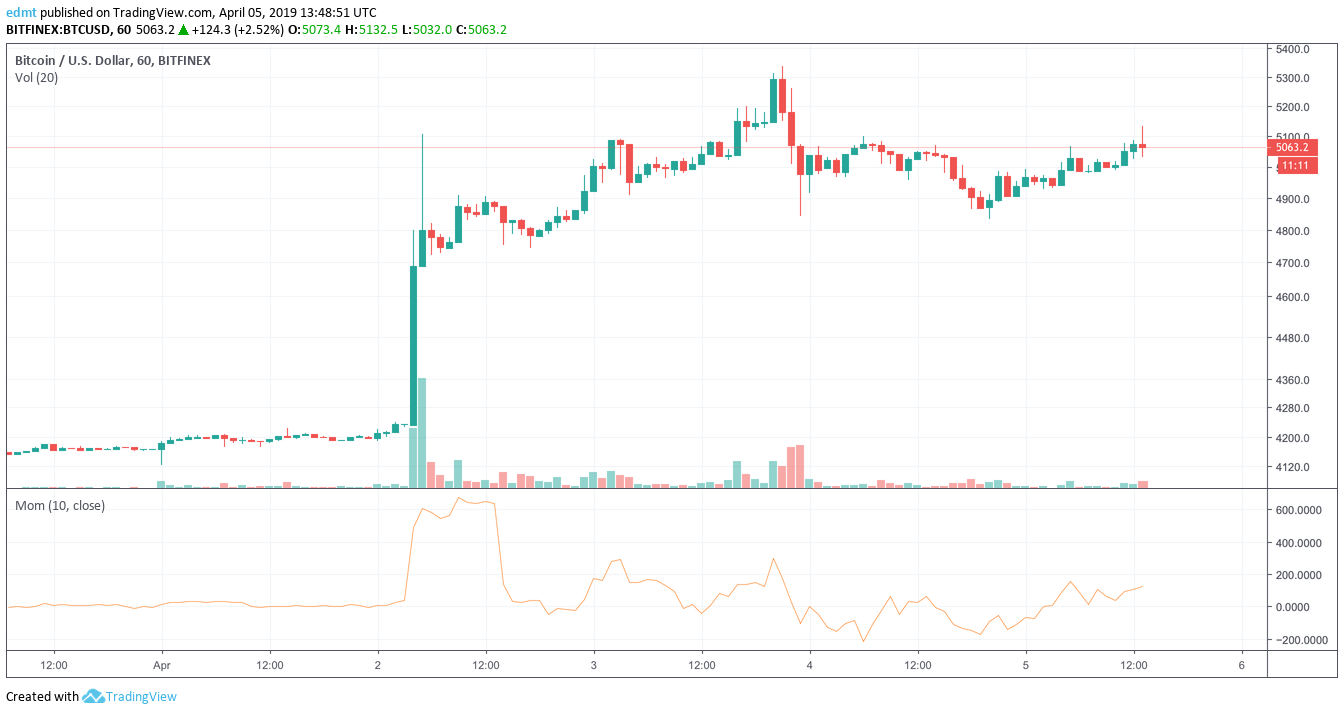
Momentum indicator is calculated as the Closing Price (CP) minus Closing price n-periods ago (CPn) (usually 10) or as (CP/CPn)* 100. The closer to the higher or lower edge the indicator meaning is, the stronger the crypto price movement. A signal to buy is if Momentum crossed Moving Average from below and vice verse for the sell signal. Rate of Change (ROC) Indicator is very similar to Momentum. It’s calculated by formula: (CP – CPn)/CPn.
Relative Strength Index (RSI)
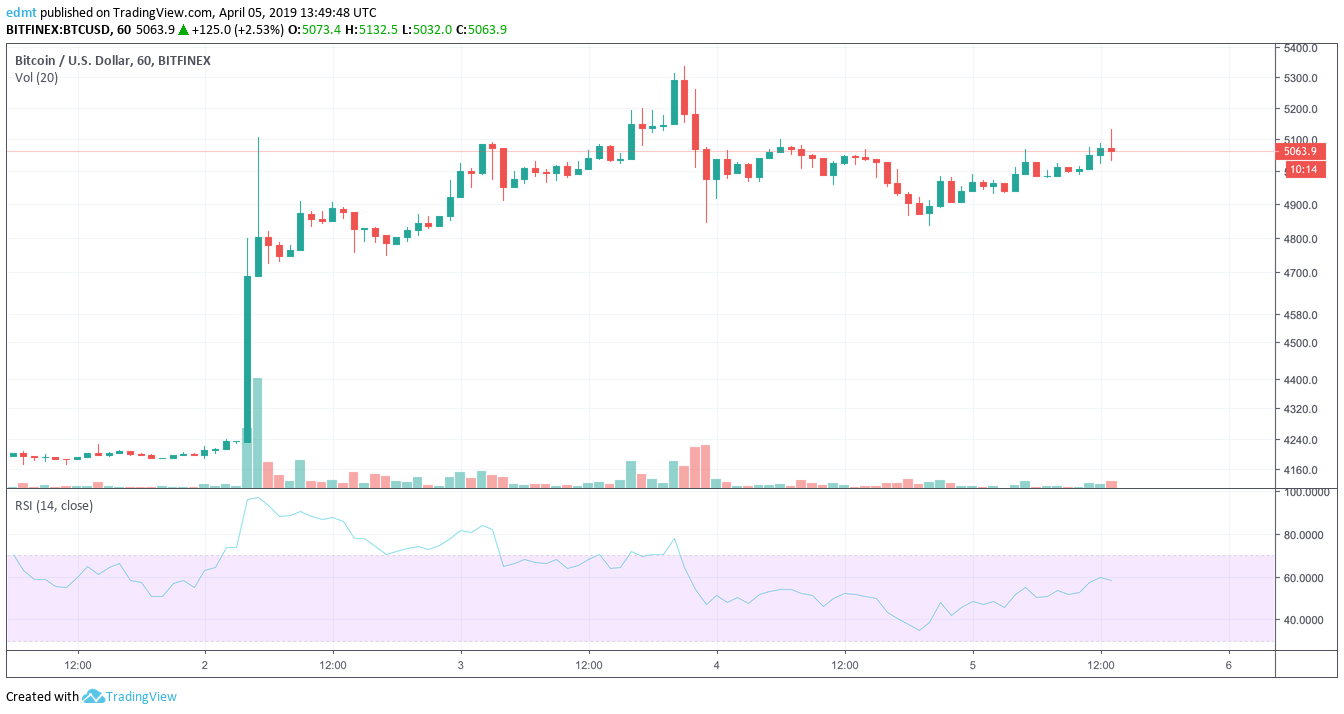
RSI is often considered as a momentum oscillator that measures the magnitude of an asset’s recent price movements. Relative Strength Index is calculated based on Average Gains and Losses, than smoothed by a formula including previous and current gains and losses. As with momentum indicator, the closer to the edge, the larger is the magnitude of the cryptocurrency price moves. If the price moves rapidly and momentum is strong, at some point an asset may be considered oversold or overbought and price reversal may be expected.
Stochastic Oscillator
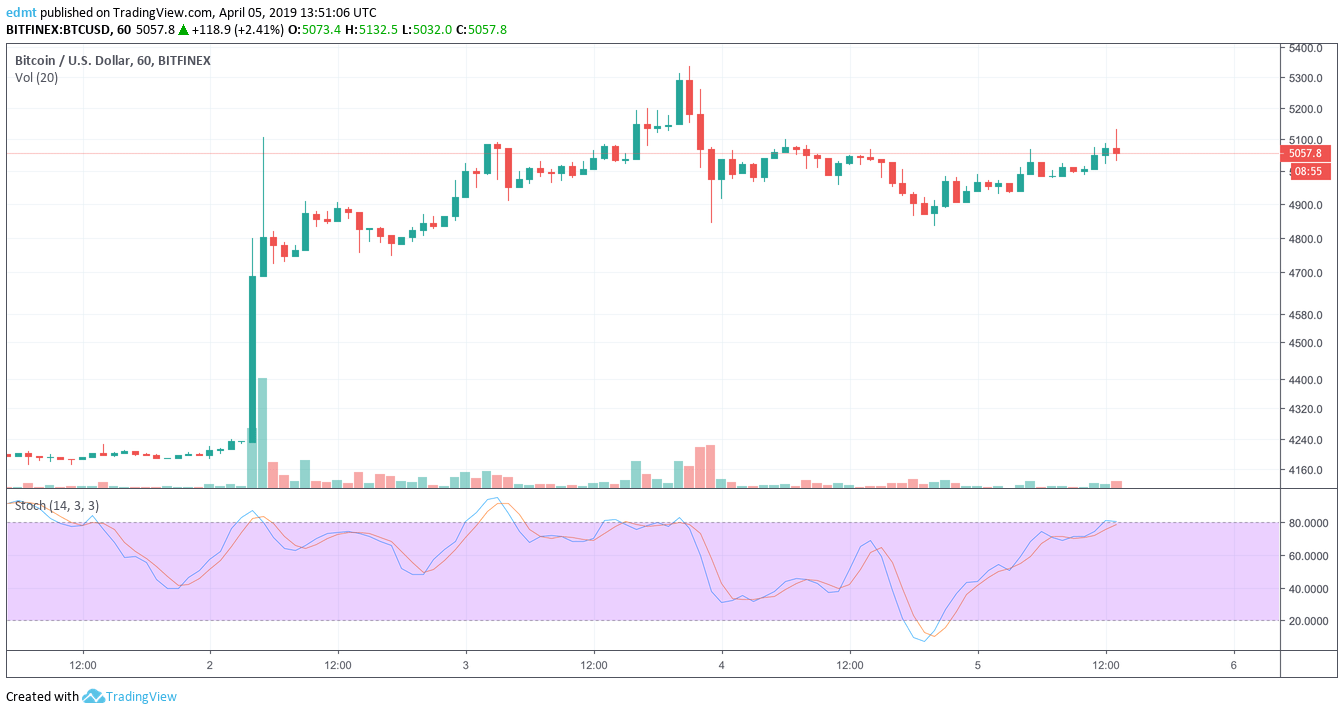
Stochastic indicator is of oscillator type and is different from the previous ones. It uses support and Resistance levels to predict price turning points instead of simply calculating recent price movements. In the core lies the idea that the price of cryptocurrency will approach extremes before turning around. When the momentum picks up the price approaches one of the graph’s edges. When the momentum slows down the price bounces back away from the boundaries. Pay attention to the convergence/divergence of the meanings of Stochastic indicator and trend lines. Divergence is a signal to act.
Commodity Channel Index (CCI)
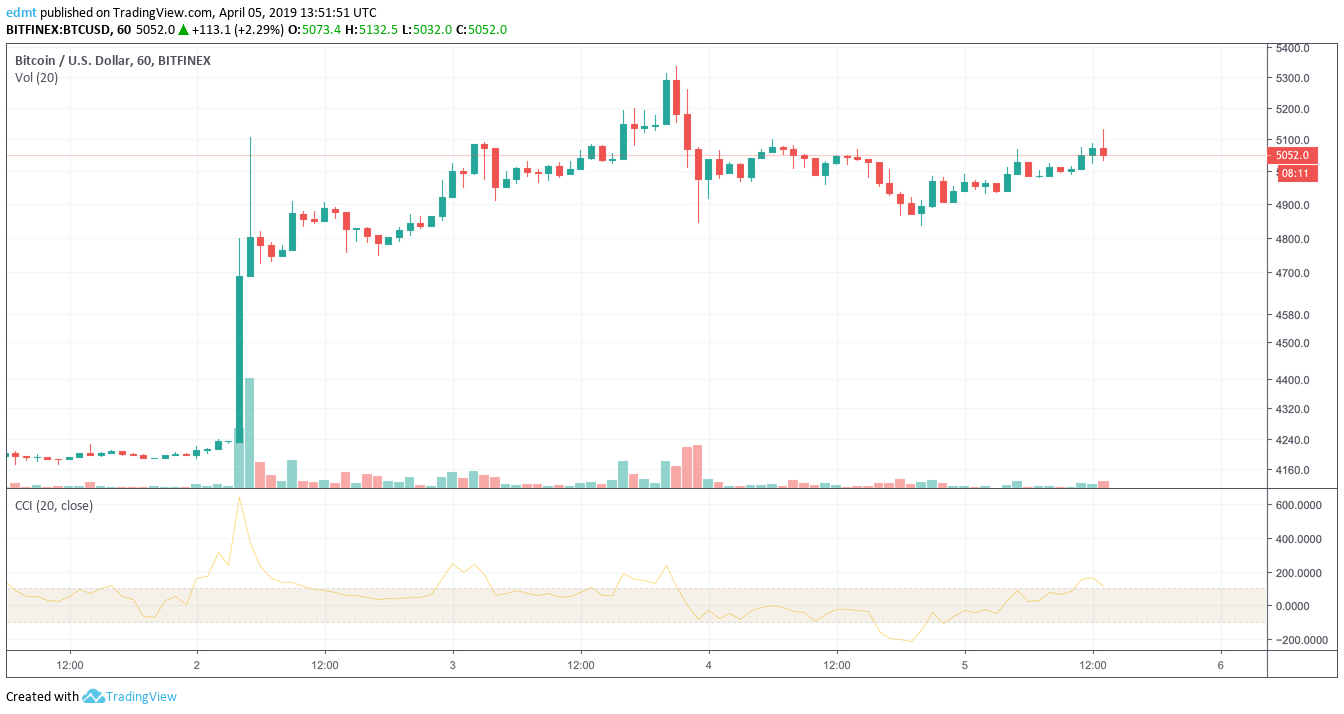
Another indicator that is used to measure the momentum of cryptocurrency is Commodity Channel Index (CCI) that is calculated as the difference between the typical price and simple moving average divided by the average absolute deviation of the typical crypto price. To make the interpretation more intuitive the result is divided by 0.0015 so that up to 80% of the values fall between -100 and +100. However, the shorter the period the more volatile is the graph and more values outside -100 and +100 range.
Moving Average Convergence/Divergence (MACD)
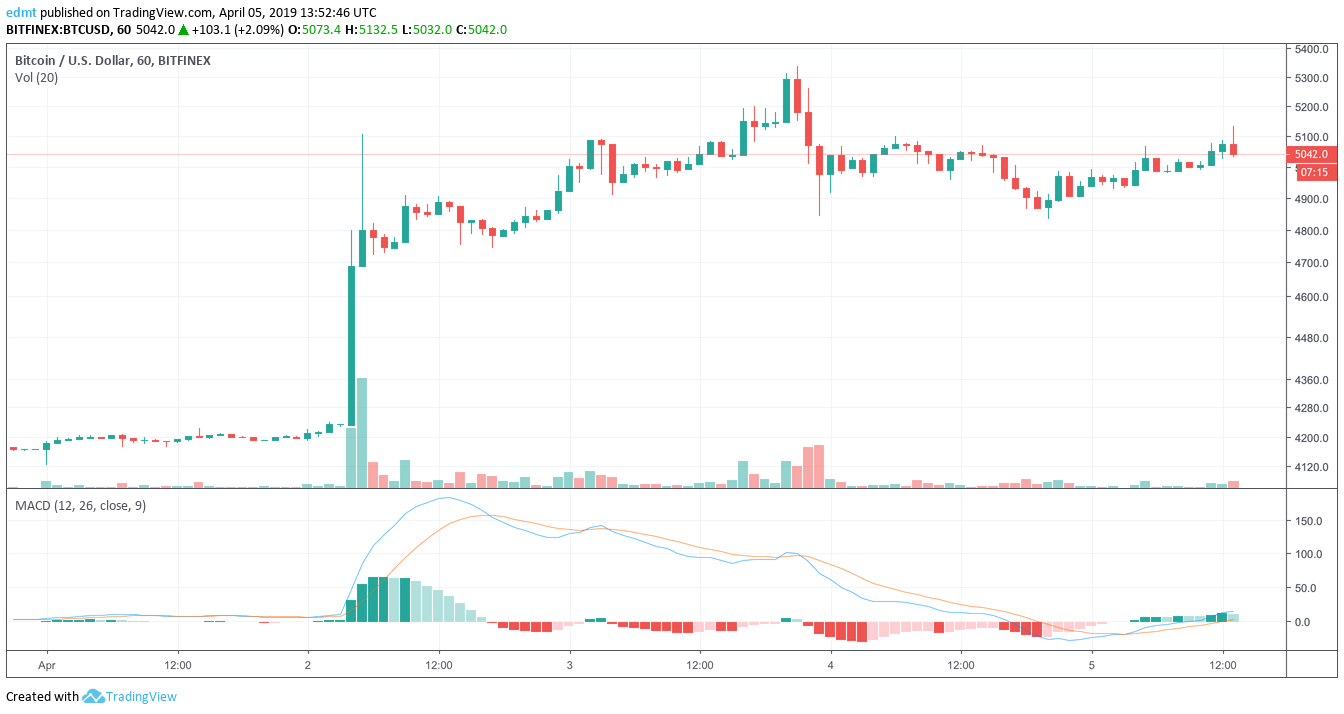
Moving Average Convergence/Divergence Indicator is also used sometimes to follow momentum. MACD is calculated by subtracting 26-period exponential moving average from 12-period exponential moving average. It’s also depicted with 9-period exponential moving average also called a signal line that serves as buy (in case MACD crosses 9-EMA from above) or sell (MACD crosses 9-EMA from below). MACD sometimes is also displayed as a histogram the values of which depict the distance between MACD and the signal line.
To get the maximum out of these indicators combine them with other types of indicators for cryptocurrencies. Use them to determine how strong the trend is and whether a price reversal may be expected in the nearest future. Momentum indicators can be especially handy when determining entry and exit points to crypto trading. One use spot an entry point or a bearish signal, don’t forget to set up a Santa trading bot to automate your activity.
FAQ
How do you use the momentum indicator?
Momentum indicators are typically represented as oscillators and rather measure the rate of price movements. They are rarely used alone, more often in combination with other indicators. Momentum indicators are most commonly applied to confirm the correct interpretation of trend indicators.
The top 4 momentum indicators include:
- Relative Strength Index (RSI)
- Stochastic Oscillator
- Commodity Channel Index (CCI)
- Moving Average Convergence/Divergence (MACD)
