Indicators are an essential part of technical analysis of cryptocurrency and your trading strategy. Their main function is to predict market direction based on historic price movement, cryptocurrency volume and other information. There are several types of crypto indicators illustrating various parameters (trend, volatility, volume, momentum, etc.) – and amongst the most famous ones are MACD (Moving Average Convergence Divergence), RSI (Relative Strength Index), etc – but in this article we will look at volume indicators.
Volume indicators demonstrate changing of trading volume over time. This information is very useful as crypto trading volume displays how strong the current trend is. For example, if the price movement shows positive dynamics and the increasing volume is obvious then the trend is strong and will more likely last longer. There are various technical tools indicating volume, but we’ll talk about the most popular ones, such as:
- On Balance Volume
- Accumulation/Distribution Line
- Money Flow Index
- Chaikin Oscillator
- Chaikin Money Flow
- Ease of Movement
Let’s look at each of them closely.
On Balance Volume (OBV)
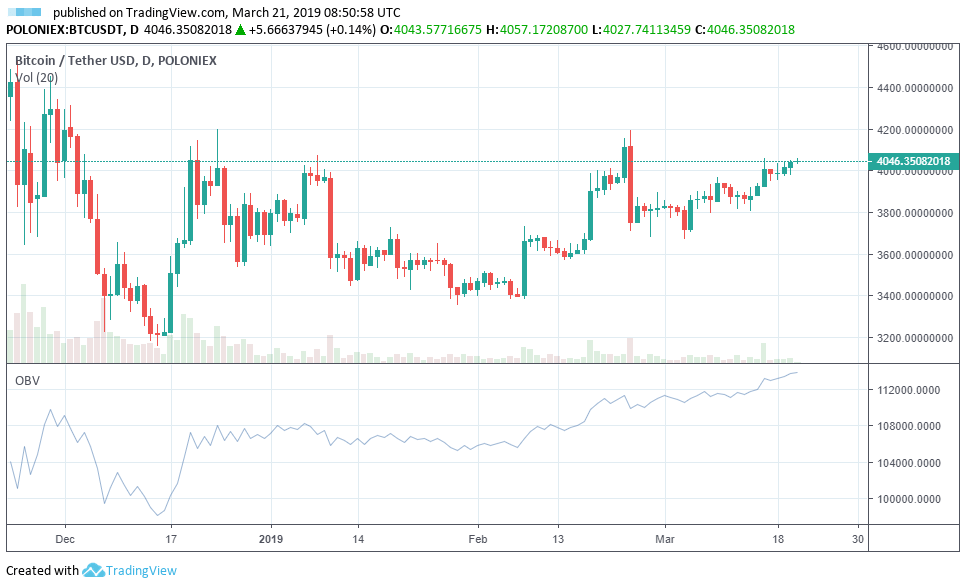
On Balance Volume is one of the most common indicators measuring volume. It is based on a cumulative total volume and matches price with volume. OBV was created by Joe Granville in 1963. The technique is pretty simple: if today’s closing price of cryptocurrency or any other currency is higher than yesterday’s, then today’s trading volume is added to the previous OBV value (OBV = previous OBV + today’s trading volume). If today’s closing price is lower, then trading volume is subtracted from the previous OBV (OBV = previous OBV – today’s trading volume). OBV can either confirm the trend by moving along with the price or indicate a possible reversal if it runs in the opposite to price direction.
Accumulation/Distribution Line (ADL)
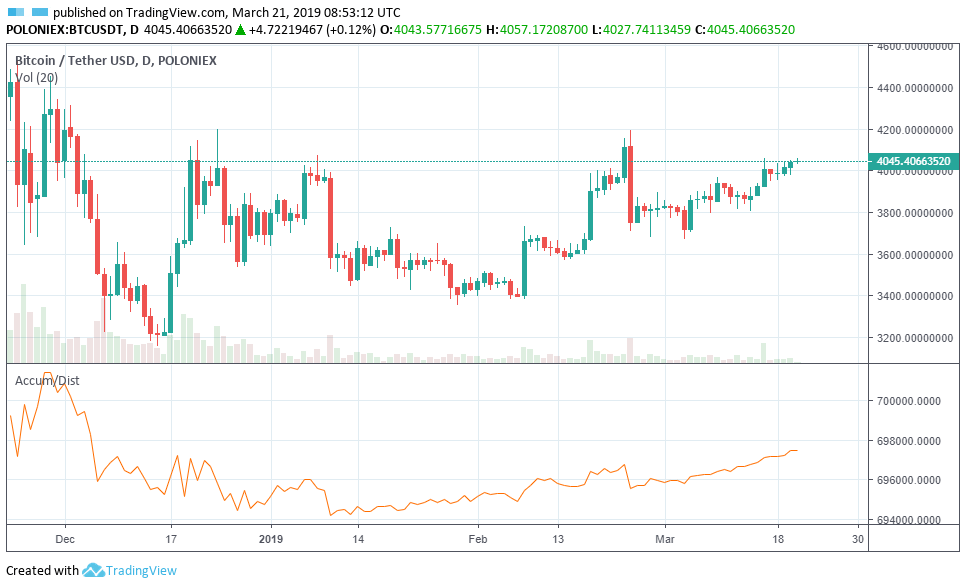
Accumulation/Distribution also takes accumulated volume into account as OBV does. To calculate the A/D’s value you should know the Money Flow Volume first. The formula is: Money Flow Volume = ((Close – Low) – (High – Close)) / (High – Low) * trading volume of the period. Then, to calculate the current A/D, current Money Flow Volume must be added to the previous A/D.
Accumulation/Distribution Line going up means the upward price trend, as the majority of the traders are buying this cryptocurrency. If the line goes down, then the bear market is clearly on the way. Divergence between the price moves and ADL means that the current trend will probably change soon and go in the same direction with the indicator.
Money Flow Index (MFI)
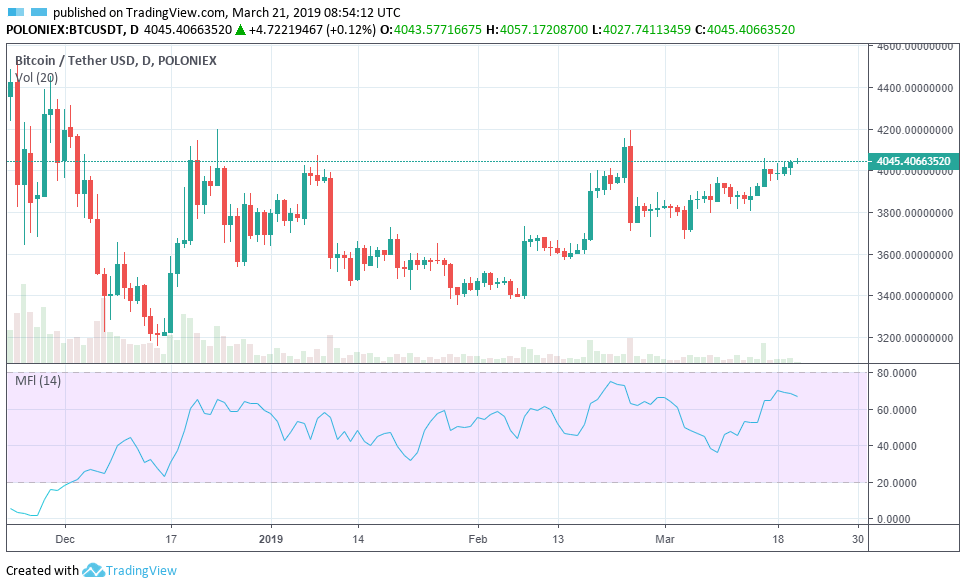
Money Flow Index is used for measuring buying and selling pressure. It is very similar to the Relative Strength Index, but with the aspect of volume. MFI is a line that moves between 0 and 100. Rising MFI indicates increasing buying pressure, falling MFI indicates increasing selling pressure. If the Money Flow Index value is above 80, then the crypto market is considered to be overbought thus indicating one should watch out for potential downturn in coins’ price. If the value is below 20 – the cryptocurrency market is oversold, thus indicating the possibility of the future price taking an upward turn.
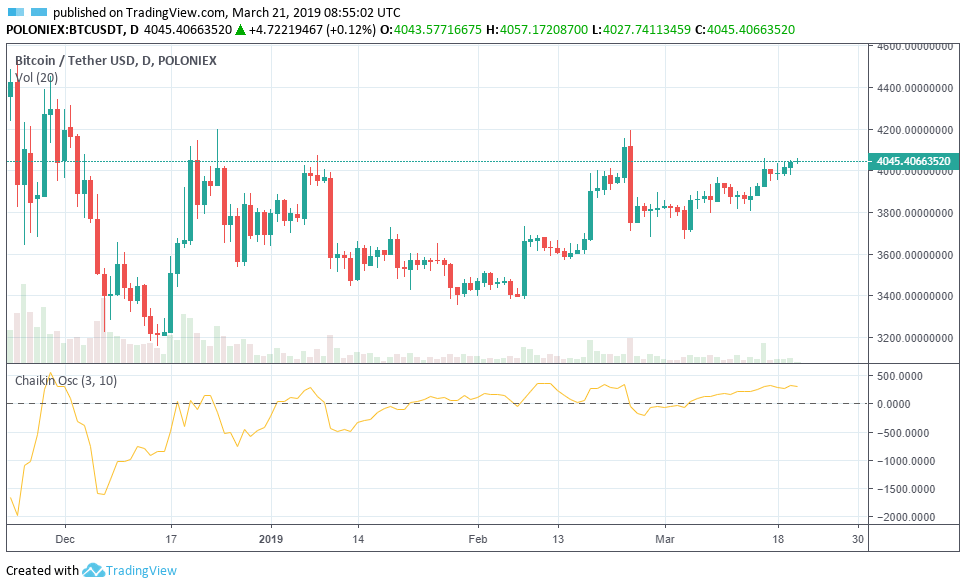
Chaikin Oscillator
The Chaikin Oscillator is a way to measure the momentum of the ADL by drawing a line which fluctuates between positive and negative values. The line is formed by subtracting the longer term exponential moving average from a shorter term exponential moving average of the ADL. Highly positive value means high ADL’s momentum and high buying pressure. Highly negative also means high ADL’s momentum but with high selling pressure. Knowing the changes in momentum can help a crypto trader to predict trend changes since changes in momentum often precede changes in trend.
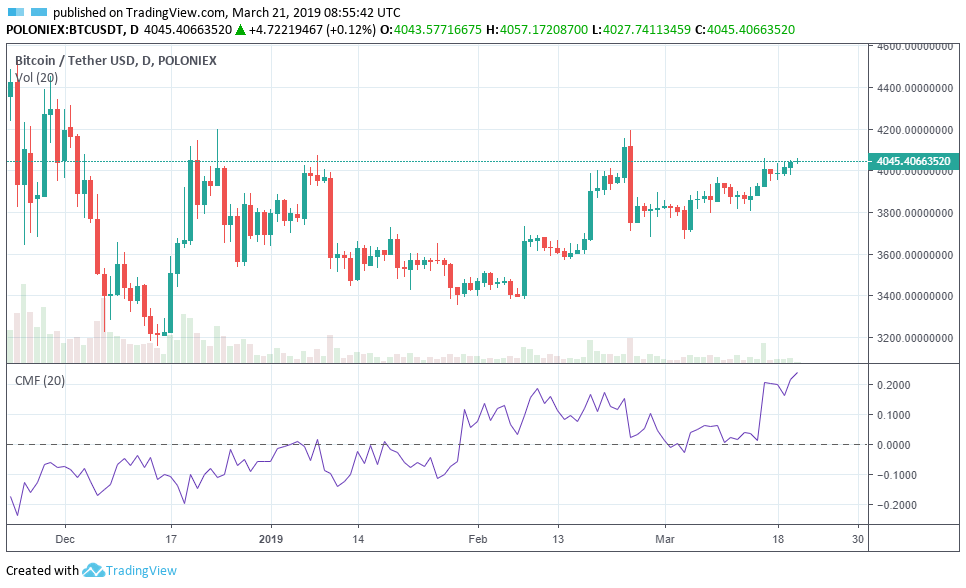
Chaikin Money Flow (CMF)
Chaikin Money Flow is a volume indicator used to measure Money Flow Volume over a set time frame. Money Flow Volume is a metric used to measure the buying and selling pressure and CMF sums Money Flow Volume over a certain period. CMF’s value fluctuates between 1 (buying pressure is higher) and -1 (selling pressure is higher). This indicator can be used as a way to further quantify changes in buying and selling pressure for cryptocurrencies and can help to predict future changes of crypto trends.
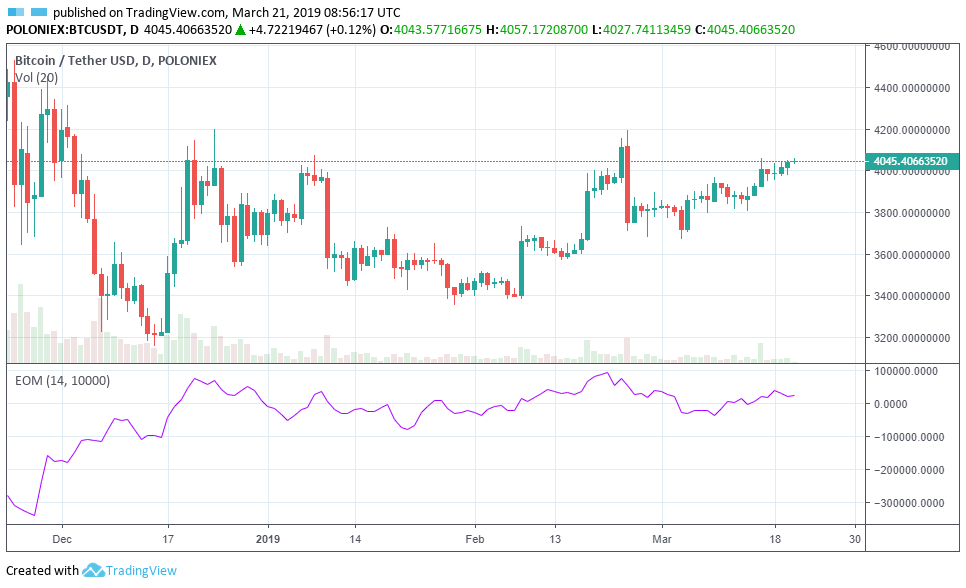
Ease Of Movement (EOM)
Ease Of Movement is an oscillator fluctuating between positive and negative values. Basically, when EOM is in high positive values, cryptocurrency price is increasing on low volumes. If the values are highly negative, price of crypto is decreasing on low volumes. In both cases low volumes indicate possible reversal. Moving average of this indicator can serve as a trigger line and generate crypto trading signals. Ease Of Movement is usually used as a secondary indicator in conjunction with other technical indicators and charts.
Various indicators to measure volume are essential when it comes to conducting technical analysis of cryptocurrency and this tool should be in every crypto trader’s arsenal. Hopefully, this article gave you a clear intro into these indicators and basics of how to use them.
FAQ
What are crypto volume indicators?
Indicators are an essential part of technical analysis of cryptocurrency. Their main function is to predict market direction based on historic price, cryptocurrency volume and other information.
How many volume indicators are out there?
There are various indicators in technical analysis measuring volume, but the most popular ones are: On Balance Volume, Accumulation/Distribution Line, Money Flow Index, Chaikin Oscillator, Chaikin Money Flow, Ease of Movement.
What is Scalping?
Scalping is a trading style characterized by creating many small trades very quickly to make small profits in the hope of summing them up at the end.
Don’t want to deal with all the technicalities and rather delegate the trading process to a third party? TradeSanta‘s bots enter and exit the market based on the signals from the technical indicators that are already set up.
Still have questions? Shoot them on Facebook, Telegram, or Twitter!
